728x90
반응형
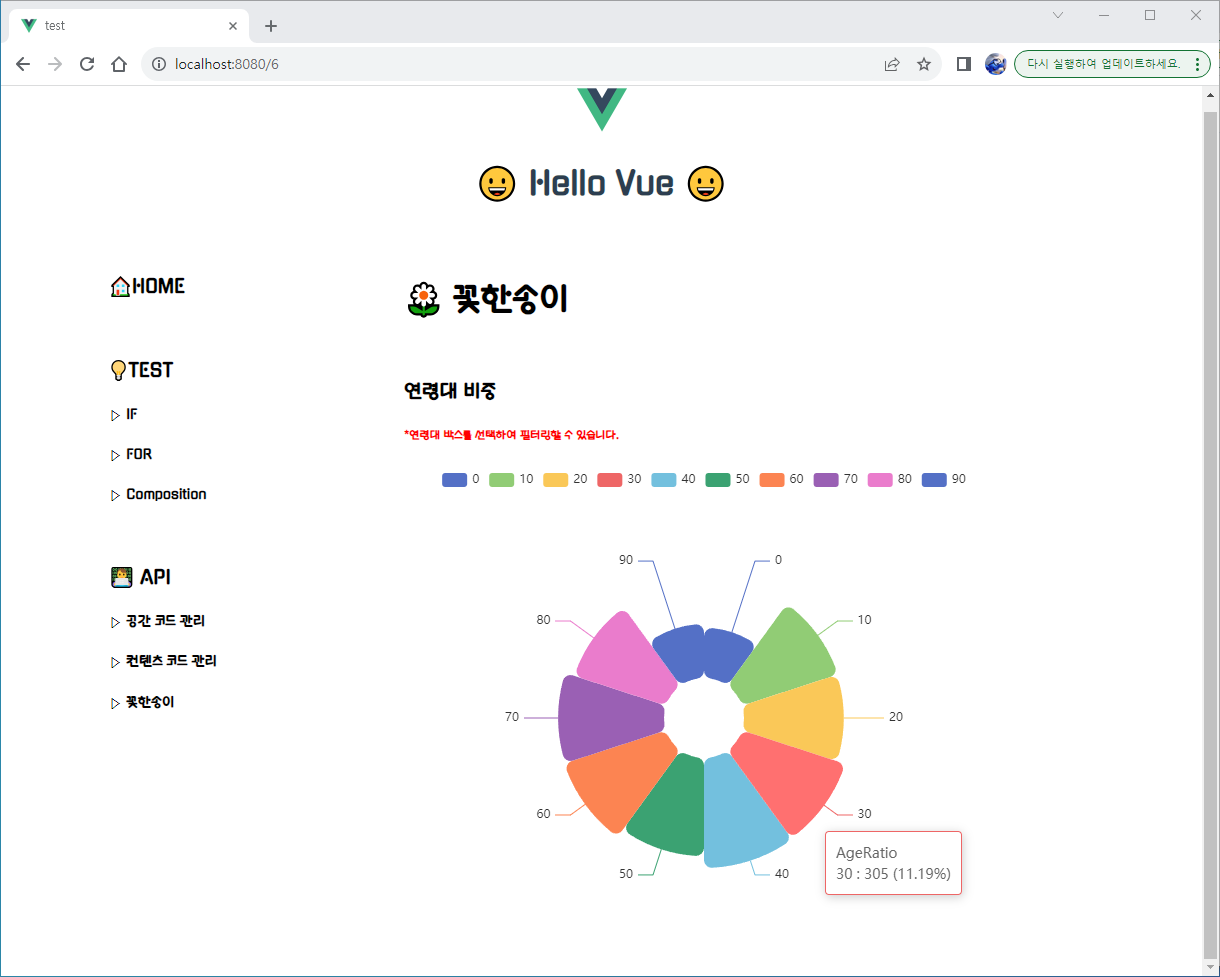
Vue-Echarts 라이브러리를 사용하여 Pie Charts를 생성하는 기초 예제
*API 관련 설명 생략
*자세한 설명 생략
▷ Vue-Echarts 설치
*vue-cli를 통해 Project 생성 후 진행
💡npm install echarts vue-echarts
▷ 기초 예제 - Pie Charts
- main.js
*Vue-ECharts 라이브러리 등록
/** Vue */
import { createApp } from 'vue'
import App from './App.vue'

/** Router */
import { router } from '@/module/router/MenuNav.js'
import { createPinia } from 'pinia'

/**Prime : 테이블 라이브러리 */
import PrimeVue from 'primevue/config';
import 'primevue/resources/themes/lara-light-teal/theme.css'

/** ECharts : 챠트 라이브러리 */
import { CanvasRenderer } from 'echarts/renderers'
import { PieChart } from 'echarts/charts'
import { TooltipComponent, LegendComponent } from 'echarts/components';
import { use } from 'echarts/core'
use([ CanvasRenderer, PieChart, TooltipComponent, LegendComponent ])

/** Vue Appicaiotn Setting */
createApp(App)
    /** 모듈 사용 등록 */
    .use(router)
    .use(createPinia())

    /** 라이브러리 사용 등록 */
    .use(PrimeVue)

    /** 연결 */
    .mount('#app')
- Cmp.css
*chart canvas
.chart {
  height: 500px;
  width: 600px;
}
- A01C01.vue
*전체 코드
<template>
    <div>
        <h1>🌼 꽃한송이</h1><br />
    </div>
    <div>
        <h3>연령대 비중</h3>
        <h6 style="color: red;">*연령대 박스를 선택하여 필터링할 수 있습니다.</h6>
        <v-chart class="chart" :option="option"/>
    </div>
</template>

<script setup>
import { ref, onMounted } from 'vue'
import { useLoginStore } from '@/module/store/LoginStore.js'
import { API_LIST, sendPost } from '@/module/AxiosModule'

import VChart from 'vue-echarts'


const ageList = [ 0, 10, 20, 30, 40, 50, 60, 70, 80, 90 ];


onMounted(() => {
    /** 로그인 체크 */
    if (useLoginStore().checkUser()) {
        /** Pie Chart 초기화 */
        getAgeRatio();
    }
})


/** Pie Chart 생성 */
const option = ref({
    legend: {
        top: "top",
    },
    tooltip: {
        trigger: "item",
        formatter: "{a} <br/>{b} : {c} ({d}%)",
    },
    series: [
        {
            name: "AgeRatio",
            type: "pie",
            radius: [40, 150],
            roseType: "area",
            itemStyle: {
                borderRadius: 8
            },
            data: []
        },
    ],
});

/** Pie Chart 초기화 */
async function getAgeRatio() {
    /* 요청 값 설정 */
    const REQ_DATA = {
        "areaCd": [
            "AREA-00"
        ],
        "ages": ageList,
        "startDate": "20231031",
        "endDate": "20231031"
    }

    /* 방문객 스캔 특정 기간 통계 조회 요청 */
    const resVO = await sendPost(API_LIST["BHS-SSC-1001"], REQ_DATA)
    /* Pie Chart Data */
    if (resVO.resultCode == "0000") {
        const resultList = []
        for (const ages of ageList) {
            const result = { name: ages, value: 0 } // Data 형식
            for (const data of resVO.result) {
                if (ages == data.visitorAges) {
                    result.value += data.visitorAgesCnt
                }
            }
            resultList.push(result)
        }
        option.value.series[0].data = resultList;
    }
}
</script>
▷ 결과 확인
▷ 참고
Apache ECharts
ECharts: A Declarative Framework for Rapid Construction of Web-based Visualization You are welcomed to cite the following paper whenever you use ECharts in your R&D projects, products, research papers, technical reports, news reports, books, presentations,
echarts.apache.org
Vue-ECharts: Vue.js component for Apache ECharts.
vue-echarts.dev
▷ 관련 글
Vue3 기초 예제 프로젝트 정리
Vue3 기초 예제 프로젝트 구조 및 소스 중간 정리 *관련 글이 점점 늘어나 하나로 통합하기 위함 *이 글에서 만 싱크 맞춤 *주석 이외 설명 생략 *자세한 설명 생략 ▷ 프로젝트 전체 구조 < 파일 따
coding-today.tistory.com
728x90
728x90


댓글